Graphs
Advertisement

RChart for Php
Set of Php Classes for creating charts and graphs. It supports more than 18 types (linechart, piechart, barchart, radarchart, curves , gauges, 3D charts, Candlestick, areacharts ....) and combinations of them. It supports also database access,
Advertisement
ESBStats - Statistical Analysis Software
Statistical Analysis and Inference Software for Windows covering everything from Average, Mode and Variance through to Hypothesis Analysis, Time Series and Linear Regression. Includes Online Help, Tutorials, Graphs, Summaries, Import/Export, Customisable
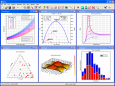
DPlot
DPlot is a general purpose graphing program designed for scientists, engineers, and students. It features multiple scaling types, including linear, logarithmic, and probability scales, as well as several special purpose XY graphs and contour plots of 3D
Grapholic
Grapholic is an excellent tool to create high quality graphs easily and quickly. The software supports multiple graph types, and allows you to import data from SQL Server, Oracle, Access database, XLS and CSV files and even enter data manually. You get
GraphSoftware
This graph tool allows you to make a graph by importing data from various data sources like excel, csv, oracle, mssql, access. you can modify the graphs with a built in canvas. Save the graphs in png,jpg,pdf format.Generate one click graph later by saving
FlyCharts Flash Chart Component
FlyCharts is a XML-driven chart flash component that gives an outstanding possibility to visualize data. FlyCharts help create interactive flash graphs and charts fast and easy. FlyCharts doesn't need installation, works with any scripting language, can
J4L-RChart for Php
Set of Php Classes for creating charts and graphs. It supports more than 18 types (linechart, piechart, barchart, radarchart, curves , gauges, 3D charts, Candlestick, areacharts ....) and combinations of them. The demo version is an encrypted but
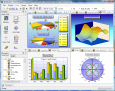
DataScene
DataScene is a data graphing, animation, and analysis software package. It allows the user to easily plot 2D & 3D graphs with scientific, financial, and statistical data, to manipulate, print, and export high quality graphs, to analyze data with various

DataScene Lite
DataScene Lite is a data graphing and data analysis software package. It allows the user to easily plot brilliant 2D & 3D graphs (Area, Bar, Pie, Line, Surface, Polar, etc) with scientific, financial, and statistical data, to manipulate, print, and export

Visual Complex v.1.7
Visual Complex is a graph software to create graph of complex function. 3D function graphs and 2D color maps can be created with this grapher.
GetData Graph Digitizer v.2 24
GetData Graph Digitizer is a program built for getting raw data out of visual graphs for analytical purposes. Most of the comparative data are usually visualized by graphs and charts.